
This is the first of a series of newsletters that should keep us connected for the duration of the CARL project. Our newsroom participated in this project together with four other European newsrooms and the project coordinator, the Czech company CVC. My name is Ondrej Podstupka, and I work for SME.sk as the deputy editor-in-chief responsible for the web and digital platforms.
In the coming months, I will coordinate a series of newsletters in which we should capture our efforts to better involve data in the functioning of our newsrooms. I would like us to show each other the best ideas that have arisen in our newsrooms and talk openly about where and why we are not doing well.
We all face the same challenge. We try to make better decisions about content and distribution in the eternally chaotic environment of journalistic creation, where content changes under our hands, stable processes are difficult to set up and key people are usually overloaded with the daily agenda.
These Newsletters should do three things:
- Introduce other members to your medium.
- Showcase your most successful data idea or process and explain why it delivers value. It could be a process, a tool, a specific dashboard, or an interesting take on a metric that moved you forward.
- Write down a key challenge that you can’t overcome. This point should help you rethink a long-standing problem and describe it in a way that is understandable to people outside your organization. It can become the basis for further debate in your editorial office or elicit insights from other participants in our program.
Who is SME?
SME.sk is a large print media that has completed its digital transformation. We have preserved the strength of the brand, the quality of the editorial and the habit of visitors to visit our headline. Good base of digital subscribers and regular visitors, keeps us running and we can rely heavily on direct visits to our website.
The power of our front page brings a certain degree of certainty because we do not have to rely on the algorithms of social networks and Google. At the same time, it focuses our entire organization too much on the performance of the front page. This complicates the launch of new verticals and slows tampers down content variability and the debate about the performance of content sections.
What works for us
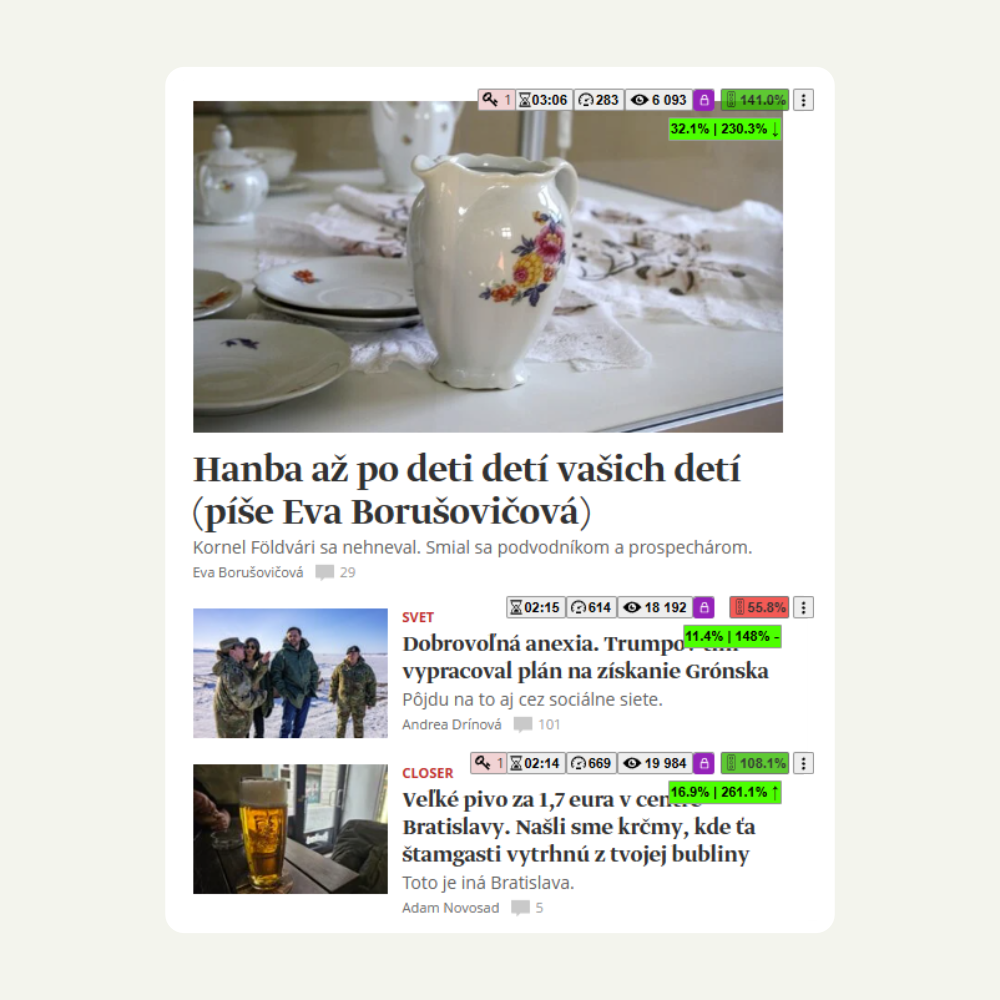
One of our most powerful tools is the in-house created Semafor. It shows the performance of our content on the headline. It works on a similar principle as, for example, the overlay from Chartbeat. The older version counted clicks against the historical average of the position. So it compares the current performance of the position at nine o’clock on Monday morning against the historical average for the position. The newer version also looks at time spent.
The traffic light is visible to the entire newsroom, giving editors and especially the headline team immediate feedback on the performance of our content. It has greatly improved the way we manage content on the headline and exposed many editors to data.
The problem is that it only points to the content on the front page, which means that even the debate about parameters has slipped into a debate about what and when is on the front page. It drowns out equally important debates about what kind of content we produce and how we promote it beyond our main distribution platform – sme.sk.
The lesson for us is that it was useful to expose the newsroom to data and speed up the feedback cycle. However, side effects must be carefully monitored.
Sore spot
We haven’t been able to start a data-based debate about content with section editors even after multiple attempts. Our editorial staff are the ones who direct the reporters and decide, which topics we cover and how are the stories presented to our readers. They are starved for time and work under immense pressure.
At the same time, they are often the first ones to notice a series of articles with low performance or an author who has not been doing well for some time. They quite logically ask us “What should they do differently”.
At the same time, successful texts seem to be unreplicable in many sections, because if a a theme or a form of the article is successful, it is not clear to the editor how they could repeat the success or at least improve the chances of replicating it.
The data itself is not the problem. If the editor “wants” to get the data, it is available, but we lack a process to interpret it into anything actionable. Passively transmitted data (in the form of a dashboard) fails to grab attention. I suspect that managing the daily output of the newsroom is already complicated and being able to deduce a meaningful formula for success seems impossible. In other words, we as an institution are not able to differentiate signal from noise in our day-to-day operation.
CARL brings feedback to the level of reporters, but they have even less room to manoeuvre when deciding on outputs.
The problem is either in the frequency with which we look at the data, in its presentation, or both. For now, however, we are stuck and it feels impossible to create even a simple data-based experiment for our content. If you have an idea how to solve this, let me know at ondrej.podstupka@sme.sk, and I will include it in the next edition of the newsletter.
Next steps
Newsletters are not the only output of this project. Several training sessions of partner newsrooms on the use of data analysis in journalism have already taken place and will continue.
Experience-sharing meetings are planned, where partners will exchange experience in this area. Involved journalists will be able to use the Carl assistant data tool, which will provide them with quick feedback (an interval of one hour and 24 hours).
All project outputs will be concentrated on the website https://dataforcreators.com/. At the end of the project, all partners will organize conferences informing the professional public, as well as other interested parties, about the results of the project.